
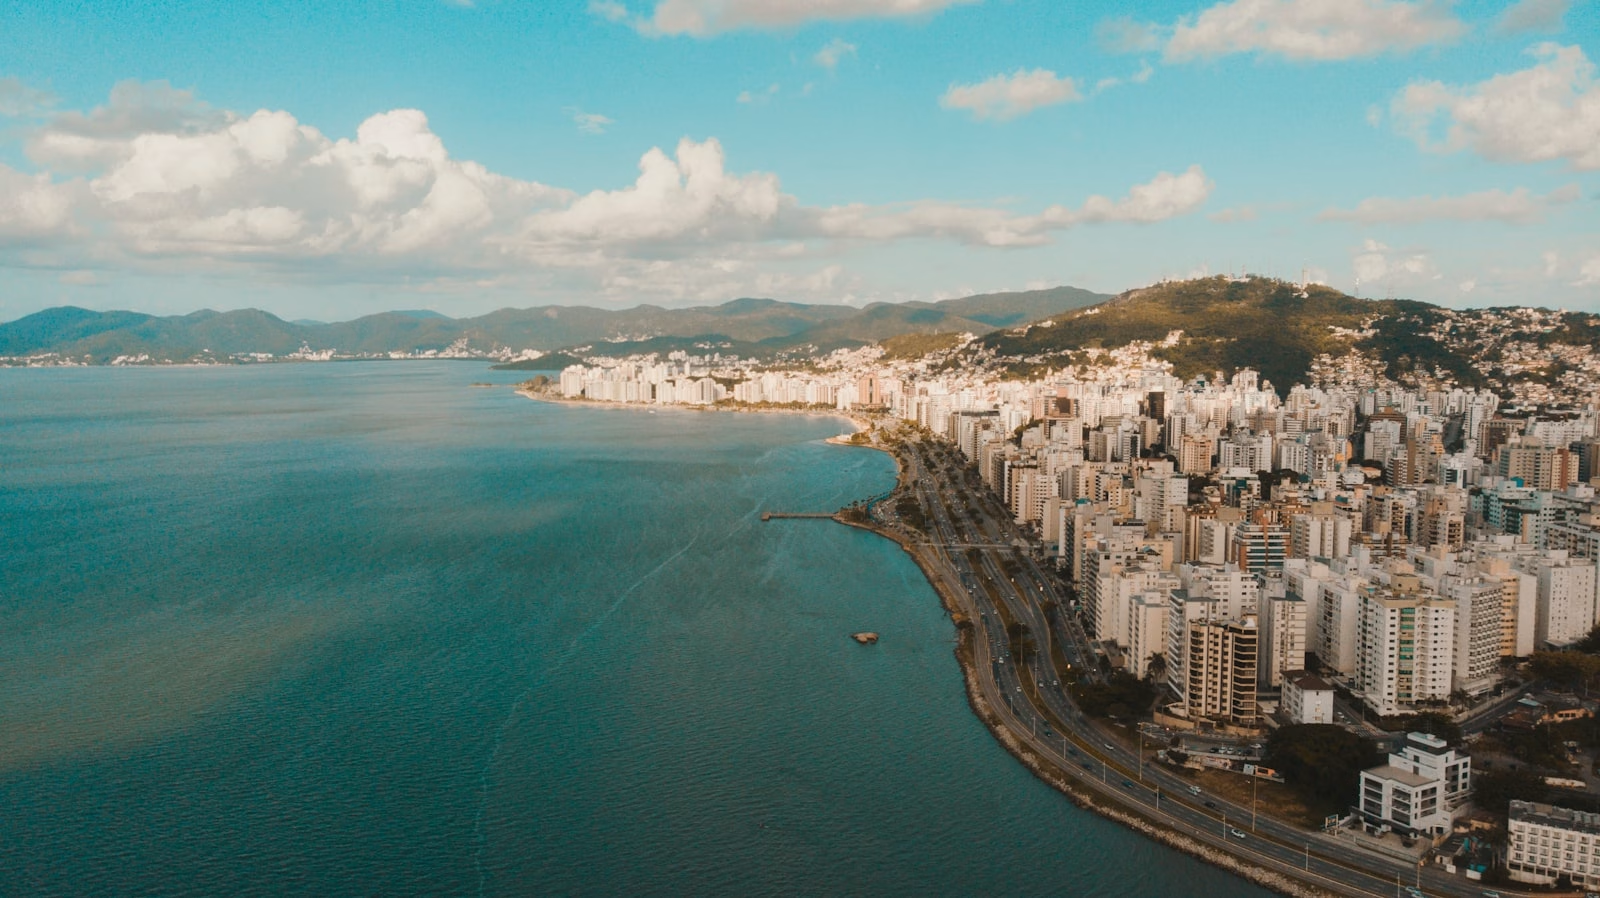
Every search for where to buy in Florianópolis runs into the same question: which neighborhood appreciates the most? The answer usually arrives as a ranking, one neighborhood at the top and a green arrow beside it. It is a useful snapshot, and an incomplete one.
The 12-month appreciation figure tells you where the price went, without saying how much of it survived inflation, or why that neighborhood rose. Two neighborhoods with the same “+10%” can mean opposite things for a buyer.
This piece presents the table of price per square meter and appreciation by neighborhood in Florianópolis, drawn from our market tracking, and shows how to read each line: what drives the rise, what inflation consumes, and what holds the price over time.
How much a square meter costs in Florianópolis in 2026
In June 2026, the average sale price per square meter in Florianópolis reached R$ 13,365, according to the FipeZAP Index. The city was up from R$ 11,766/m² in December 2024 and R$ 12,773/m² in December 2025, when it ranked as the second most expensive state capital in Brazil.
The average price and its place in the national ranking
The trajectory is one of steady growth: R$ 13,106/m² in March, R$ 13,208/m² in April, and R$ 13,365/m² in June 2026. Among all Brazilian cities, not just the state capitals, Balneário Camboriú, Itapema, Vitória, and Itajaí come out ahead, which places Florianópolis as the fifth most expensive market in April 2026.
Why the average hides the gap between neighborhoods
The average works as a thermometer, and it lets the essential slip by. In Florianópolis, the square meter ranges from around R$ 9,000 in Ingleses to more than R$ 25,000 in Jurerê Internacional. That is the distance between two markets inside the same city. The neighborhood ranking tells the story the average erases.
The table: appreciation by neighborhood
The figures below come from Regente’s market tracking, with reference prices from April 2026 and the change recorded in the most recent period of each source. Treat the percentages as general direction, with a margin in the decimal place: the exact period varies by survey.
| Neighborhood | Average price per m² | Recent change |
|---|---|---|
| Jurerê Internacional | R$ 25,136 | +50% |
| Campeche Norte | R$ 18,751 | +9% |
| Agronômica | R$ 15,818 | +34% |
| Centro | R$ 14,041 | +9.5% |
| Coqueiros | R$ 9,462 to R$ 13,650 | +13% |
| Córrego Grande | R$ 12,615 | +5.4% |
| Trindade | R$ 12,333 | +5% |
| Ingleses | R$ 9,025 | +28% |
The biggest risers: Jurerê, Agronômica, and Ingleses
Jurerê Internacional leads on both price and gain, with the square meter at R$ 25,136 and appreciation near 50% in the recent period, driven by large properties and a scarce stock of land. Agronômica rose about 34%, supported by its proximity to downtown and by new high-end developments. Ingleses, on the north of the island, advanced close to 28% from a much lower base price, which tends to attract buyers looking for an affordable entry point.
The consolidated ones: Campeche, Coqueiros, and Centro
Campeche Norte, at R$ 18,751/m², and Coqueiros, in the R$ 9,462 to R$ 13,650 range, grew around 9% and 13%, with demand tied to lifestyle and the shoreline. Centro (the downtown district), at R$ 14,041/m², appreciated about 9.5% and is going through a phase of urban renewal that is changing how the neighborhood is perceived.
The stable ones: Córrego Grande and Trindade
Córrego Grande (R$ 12,615/m², +5.4%) and Trindade (R$ 12,333/m², around 5%) show the mature side of the market: consolidated neighborhoods, with firm demand and a gentler rise. For those seeking liquidity and an established neighborhood, the smaller change comes with less risk.
Resale vs. new builds: the premium on new
Within the same neighborhood, a newly launched property costs more per square meter than a resale one. The difference comes from the new construction standard, the efficiency requirements entering 2026 projects, and the developer’s payment terms, which hold the list price and avoid discounts that would erode the margin.
Campeche shows the size of that gap. New properties launched in the neighborhood posted an average of R$ 22,100/m², according to Sinduscon Grande Florianópolis (the regional construction industry union) in partnership with Alphaplan (September 2025), while resale in the same Campeche trades between R$ 8,000 and R$ 11,000/m². That is a premium of more than 100% for buyers of new construction. It is no coincidence that Campeche recorded the largest number of approved building permits in Florianópolis between 2023 and 2025, with a strong pipeline of launches ahead.
The pattern repeats at the top: in Jurerê Internacional, new units go above R$ 25,000/m². For the investor, buying off-plan is the way to capture the appreciation during construction, with the premium on new already built into the entry price.
A note on method: the figures above are source averages, not a statistical standard deviation. The real dispersion between resale and new builds, neighborhood by neighborhood, would require the individual-listing base, which the public indices do not open at that level of detail. Where the comparison exists with a reliable number, the message holds: new enters at a premium, and resale is the cheapest way into the neighborhood.
What the nominal ranking hides
Here is the point that separates an informed decision from a bet on the green number.
FipeZAP vs. IGMI-R: why the indices diverge
FipeZAP measures asking prices, which makes it fast and sensitive to market mood. The IGMI-R, from ABECIP (Brazil’s mortgage lenders’ association) with FGV, starts from bank appraisals in financing operations, closer to the value actually transacted. The two often diverge: in 2022 and 2023, IGMI-R pointed to gains of 15.06% and 12.98%, above FipeZAP over the same period. When the indices disagree, the exact percentage becomes an estimate.
Real appreciation, net of inflation
A price that rises 10% in a year of 5% inflation truly returns 5%. That math changes the picture. Cumulatively from 2014 to 2024, the national FipeZAP rose 41.6%, while Brazil’s official inflation index (IPCAIPCA — Índice Nacional de Preços ao Consumidor AmploPrincipal indicador oficial de inflação do Brasil, medido pelo IBGE mensalmente. Referência para reajuste de aluguéis, financiamentos e títulos do Tesouro.Ver tudo →) advanced 85.8%: in real terms, the average property fell about 23.7% over the period. Florianópolis performed above the national average, and the honest reading is that a decade’s real gain depends heavily on the window chosen. The nominal appreciation impresses; the real gain asks for patience.
What makes a neighborhood appreciate (and how to choose)
The fundamentals: restricted supply, infrastructure, and new hubs
Florianópolis appreciates above the average for structural reasons: the island has a limited supply of land, the population is growing, and new work and service hubs are forming. Where supply is more restricted and infrastructure improves, the price tends to sustain its rise. Jurerê and Agronômica illustrate the two sides, with a scarcity of high-end stock in one case and qualified densification in the other.
Appreciation vs. income: the yield the table does not show
The table speaks of price, and the investor also lives on income. The average gross rental yield in Florianópolis sits between 5.6% and 5.96% per year, and falls to a range of 3% to 4.5% net after management fees, the municipal property tax (IPTUIPTU — Imposto Predial e Territorial UrbanoTributo municipal anual sobre imóveis urbanos. Base de cálculo é o valor venal — quase sempre abaixo do valor de mercado — definido pela prefeitura.Ver tudo →), vacancy, and maintenance. A neighborhood may appreciate little and yield well, or the other way around. Looking only at appreciation leaves half the math out.
How to read it by your goal: to live or to invest
To live in, what matters is the fit with your routine, and appreciation comes as a long-term bonus. To invest, the decision combines three variables: entry price, appreciation potential, and rental income. The neighborhood at the top of the ranking is rarely the best on all three at once.
Frequently asked questions
Which neighborhood appreciates the most in Florianópolis?
In the most recent survey, Jurerê Internacional leads, with the square meter around R$ 25,136 and recent appreciation near 50%. Agronômica (+34%) and Ingleses (+28%) follow. The highest percentage usually comes with the highest entry price or the greatest volatility.
How much does a square meter cost in Florianópolis in 2026?
The average sale price reached R$ 13,365/m² in June 2026, per the FipeZAP Index. By neighborhood, the value ranges from around R$ 9,000/m² in Ingleses to more than R$ 25,000/m² in Jurerê Internacional.
Is property appreciation the same as real profit?
They are different things. Nominal appreciation is the price rise without discounting inflation, and the real gain is what is left after it. Between 2014 and 2024, the national index rose less than Brazil’s official inflation index (IPCA), which meant a real loss over the period. That is why appreciation should be read together with inflation and with the time horizon.
Does a new-build property cost more than a resale one in the same neighborhood?
Yes. In the same neighborhood, a new build usually comes out more expensive per square meter than a resale one, because of the new standard and the developer’s terms. In Campeche, for example, new posted an average of R$ 22,100/m² (Sinduscon Grande Florianópolis with Alphaplan, Sept. 2025), while resale sits between R$ 8,000 and R$ 11,000. The premium on new is the price of capturing the construction’s appreciation from the start.
Does Jurerê Internacional still appreciate?
Jurerê remains at the top on price and recent gains, sustained by the scarcity of large properties and land. It is a high-ticket market, with more selective liquidity. Its historical appreciation is strong, and the decision to enter depends on the horizon and the investor’s profile.
Which is worth more: appreciation or rental income?
It depends on the goal. Appreciation pays off at the sale, over the long term, while rental income pays along the way, with an average gross yield of 5.6% to 5.96% per year in Florianópolis. A balanced portfolio considers both, with one neighborhood that appreciates and another that yields well playing different roles.
Where to invest in Florianópolis on a smaller budget?
Neighborhoods with a more affordable base price and consistent appreciation, such as Ingleses on the north of the island, let you enter with a smaller ticket. The right choice combines your budget with the neighborhood’s income potential and liquidity, rather than chasing the highest percentage in the table.
The appreciation table is the start of the conversation. It shows where the price went, and the rest of the decision lives in what it does not say: how much was left after inflation, how much the property yields in rent, and what holds the neighborhood’s price over time.
Jurerê leads on price, Agronômica and Ingleses on pace, the consolidated neighborhoods on safety. Each line serves a different goal. If you want a read on the appreciation of the neighborhood that interests you, with price, income, and fundamentals in the same conversation, talk to Regente: we translate the table into your decision.