There’s a question that comes up in practically every conversation about real estate investment: “Is it time to buy now or should I wait a little longer?”
The most honest version of the answer begins with another question: wait for what, exactly?
If the answer is “wait for prices to fall,” historical data doesn’t support that thesis well in markets with solid demand fundamentals. If the answer is “wait for the project to be completed to have more certainty,” the data doesn’t support that either — because in documented cases, those who waited for the project to be completed paid for the results that others had already captured.
This guide analyzes purchase timing across six real cases where the decision of when to buy made a significant difference.
1. Why Timing Matters More Than Price Per Square Meter
Most buyers spend more time negotiating price than analyzing the moment of purchase. This is understandable — price is visible, timing is abstract.
But in documented cases, the difference between buying two years before or two years after an inflection point in a market produced returns that no price negotiation could replicate.
The mechanism is simple: property in an area undergoing urban transformation has a price before the transformation is perceived and a price after. The transition between the two prices happens when the market — buyers, real estate agents, lenders, press — begins to price the future, not the present.
This moment doesn’t coincide with project completion. It coincides with when the market believes the works will happen.
2. Lisbon — Parque das Nações: The Window From 1998 to 2004
The context: Expo 98 was announced for Lisbon in 1993. Transformation of the degraded port area in the city’s northeast began in 1994. The event took place in 1998. The neighborhood — Parque das Nações — was consolidated gradually over the following years.
Timing of purchase:
| Period | Project Status | Relative Price | 20-Year Return |
|---|---|---|---|
| 1994–1996 | Construction underway, degraded area | Lowest | Maximum |
| 1998–2002 | Expo complete, neighborhood consolidating | Medium-low | High |
| 2004–2008 | Neighborhood recognized as premium | Medium | Moderate |
| After 2010 | Neighborhood consolidated, priced as such | High | Low differential |
The result: those who bought between 1998 and 2004 — during and right after Expo — captured appreciation of +300% over the following 20 years. Parque das Nações went from a degraded area to one of Lisbon’s most valued addresses.
The timing lesson: the biggest entry window wasn’t at project completion. It was during construction, when the area still seemed risky to most buyers.
3. Bilbao — The Guggenheim and Port Regeneration
The context: Bilbao in 1991 was an industrial city in collapse — 25% unemployment, polluted river, abandoned port area. The urban regeneration plan began with the Guggenheim project (approved in 1991, completed in 1997) but included broader interventions on the Nervión River waterfront.
The critical timing: those who bought in the intervention corridor between 1991 and 1995 — when Bilbao was a city in obvious decline — bought before regeneration was priced in. The Guggenheim opened in 1997 and the market began pricing the “Bilbao effect” in the years that followed.
The result: areas near the intervention corridor appreciated +150% in the decades that followed. Those who waited for the museum opening to have “more certainty” paid a significant part of that differential.
The timing lesson: the lowest entry price exists when risk is highest and transformation is not visible. The equation doesn’t change — what changes is each buyer’s willingness to tolerate uncertainty.
4. Copenhagen — Gehl Interventions: The Permanent Differential
The context: The Gehl Architects office progressively redesigned urban corridors in Copenhagen throughout the 1990s and 2000s. Each intervention — bike lane, sidewalk expansion, pedestrianization, plaza improvement — created a price differential in the affected area.
The documented pattern: properties in Copenhagen’s Gehl intervention areas appreciate between +20% and +40% above the rest of the city. The differential doesn’t disappear — it becomes permanent because public space quality is an asset that doesn’t depreciate.
Nyhavn: Copenhagen’s most famous tourist canal was redesigned by Jan Gehl in 1980. Those who bought in Nyhavn before the redesign, when it was an area of sailor bars, captured appreciation that transformed the area into the city’s most expensive address — today DKK 67,000/m².
The timing lesson: Gehl projects generate a permanent price differential, not a temporary one. The differential sets in during and after the works, not before.
5. King’s Cross, London: 15 Years of Patience, +70% Result
The context: The King’s Cross reconversion project was announced in 2001, gradually initiated from 2007 onwards, and completed over more than a decade. The area went from a degraded railway yard to one of London’s most active urban hubs.
Timing: those who bought in 2003–2005, when the project was only on paper and the area was still considered problematic, captured the largest differential. Appreciation of +70% materialized over a decade and a half.
The lesson: King’s Cross most explicitly shows the necessary horizon. Those who waited 5 years to “see the project progress” still captured part of the differential. Those who waited 10 years captured much less. Those who bought with a 15-year horizon captured everything.
Perfect timing doesn’t exist. But the principle that the bigger window is before — and not after — construction is consistent across all cases.
6. Auckland and Puerto Madero: Marina as Multiplier
Auckland Viaduct (New Zealand): the Viaduct Harbour area was revitalized before the 2000 America’s Cup for Sailing. Those who bought during construction — before the opening — captured +50% in three years.
Puerto Madero (Buenos Aires): former port area transformed into a residential and gastronomic neighborhood. Those who bought in the initial project phase — when it was an abandoned area — saw the property reach the level of 75% above Buenos Aires’ second most expensive neighborhood (Recoleta). That difference persists today.
The marina pattern: in all cases where intervention includes qualified waterfront — marina, linear park along the water, city-sea reconnection — the price differential tends to be larger and more persistent than in purely land-based interventions. Waterfront is scarce by definition.
7. How to Apply This Logic to Florianópolis in 2026
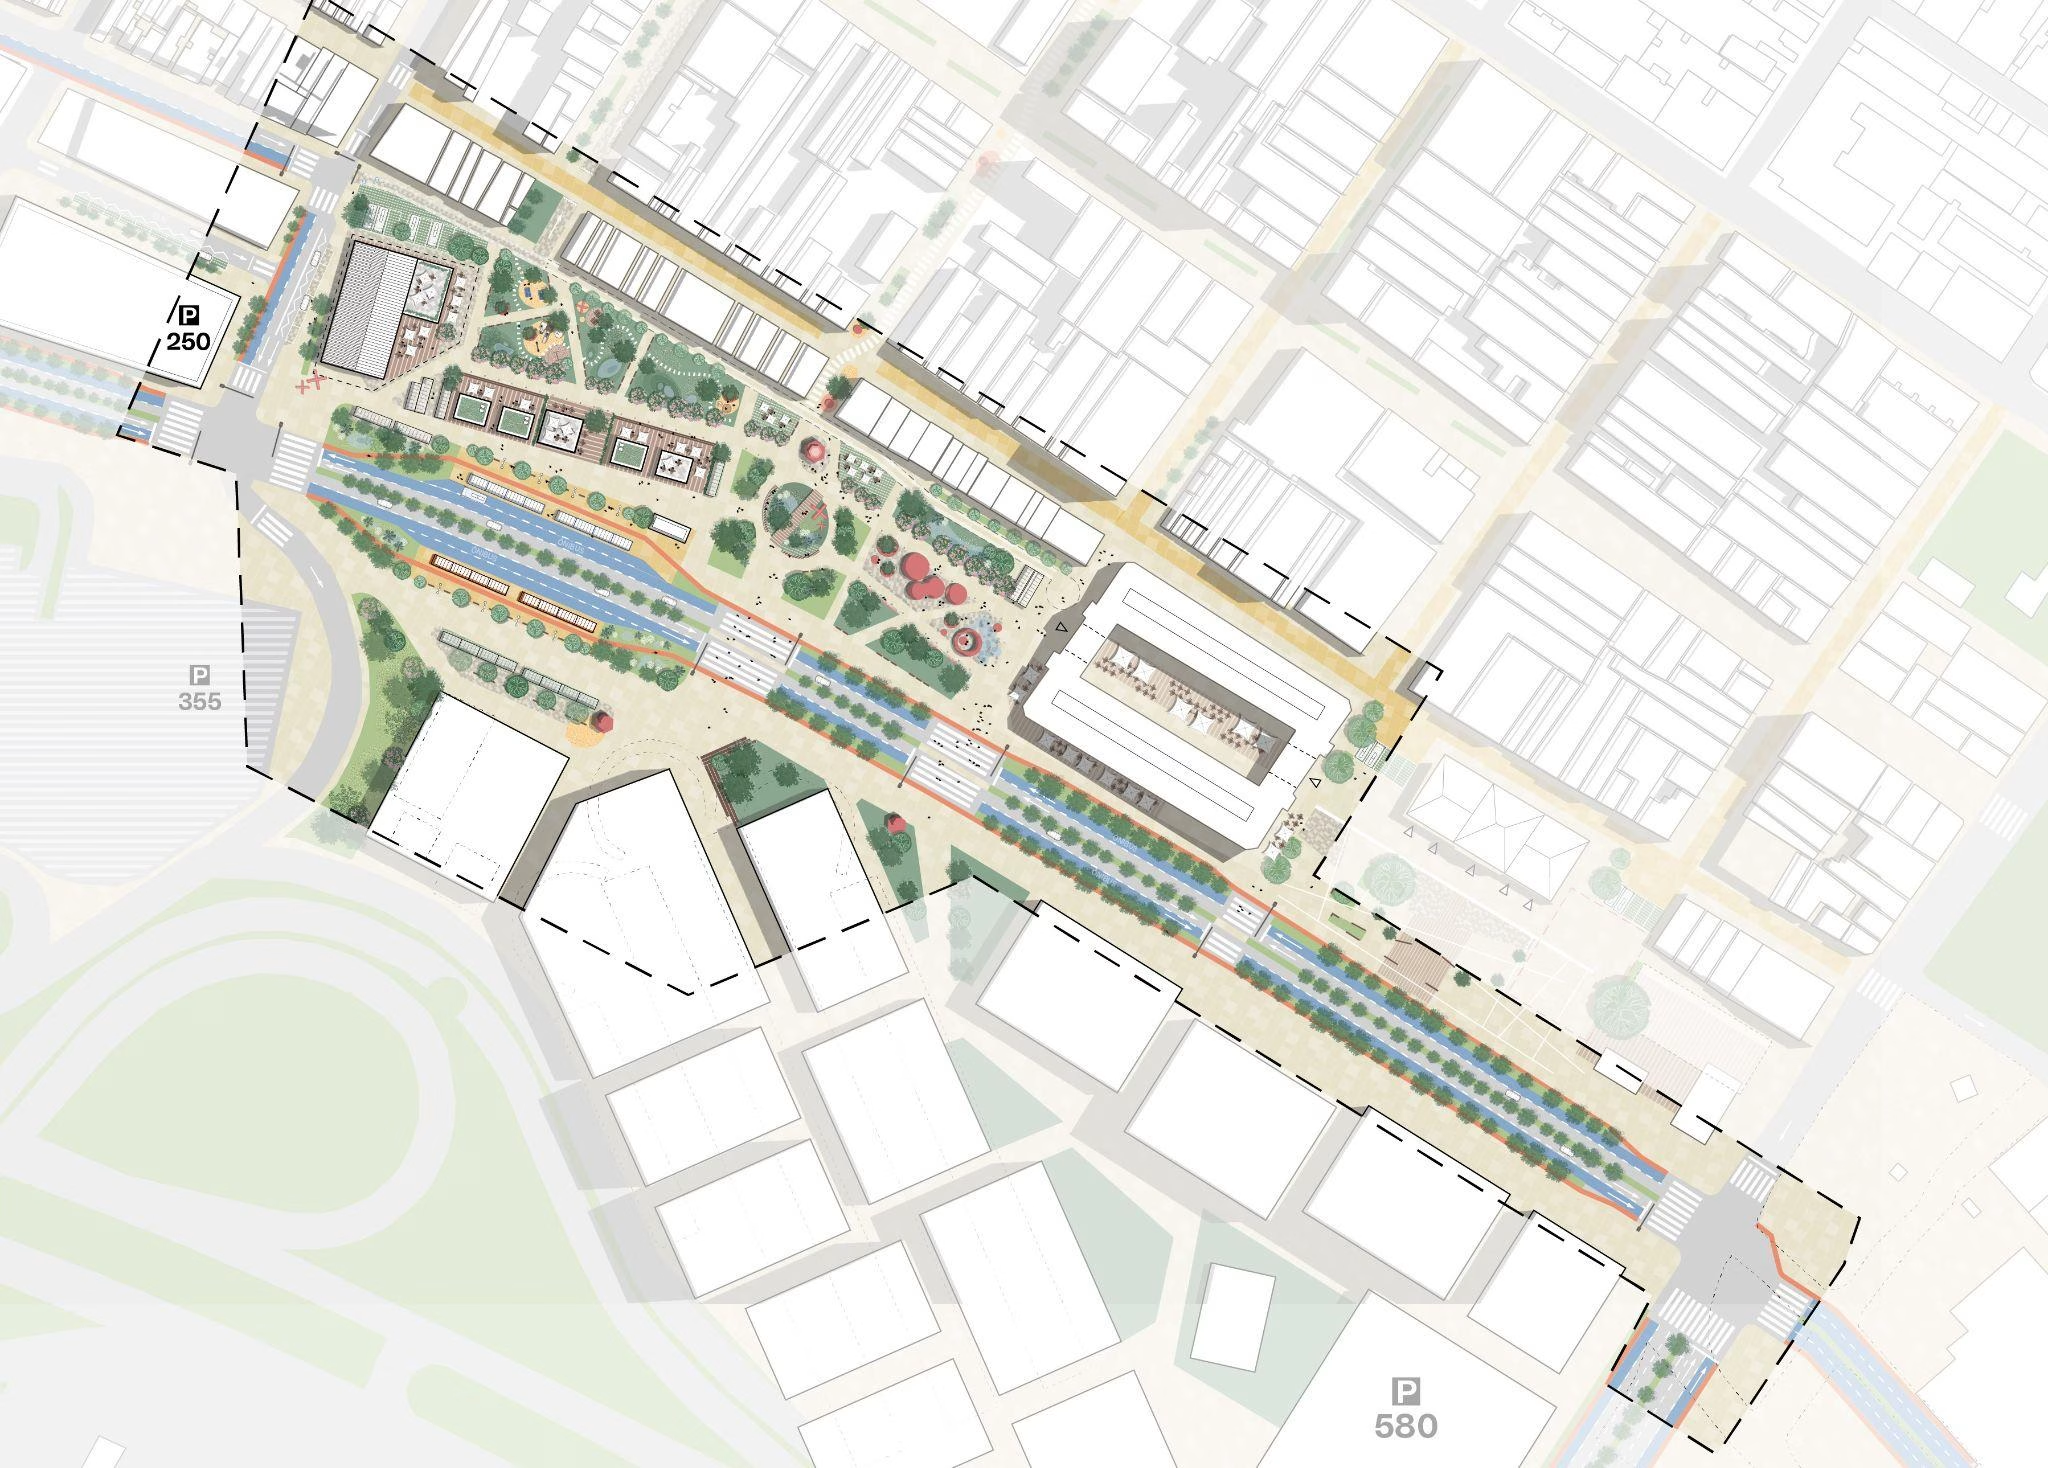
The Gehl Plan for Florianópolis was delivered in February 2026. The document exists, was prepared by an office with documented track record, was commissioned by institutions that have interest in its execution (CDL, ACIF, City Hall). Construction has not yet begun.
By the logic documented in the six cases above, Florianópolis is at the equivalent stage of:
– Lisbon in 1996–1997 (construction underway, before Expo)
– Bilbao in 1994–1996 (Guggenheim approved, still under construction)
– King’s Cross in 2004–2005 (project announced, beginning of works)
At all these reference points, the entry price didn’t yet embed the transformation. The greatest potential for returns lay ahead.
What differentiated those who got it right in all these cases:
They did execution analysis, not just potential analysis. The question wasn’t “how much can this appreciate?” but “what’s the real probability this project will be executed?”
They bought the right product in the right neighborhood. In Lisbon, it wasn’t any property in Parque das Nações — it was the product with typology compatible with the new neighborhood’s tenant base. In Bilbao, it wasn’t any property in the city — it was the product in the intervention corridor.
They had a compatible horizon. None of the cases generated significant returns in two or three years. The minimum documented was five years (Auckland). The most common was eight to fifteen years.
FAQ
What is the best time to buy a property in a revitalization area?
Documented cases consistently show that the largest return differential is captured before construction begins — when the project exists on paper but hasn’t yet been priced by the market. The second best time is during construction. After completion, the market has already embedded the results in the price. The downside of buying early is the risk that the project won’t be executed — which is why execution analysis is as important as potential analysis.
How does timing work in urban revitalization projects?
The price of a property in an area undergoing urban transformation rises when the market begins to believe the transformation will happen — not when it ends. This repricing moment typically occurs between the project’s serious announcement and the start of construction, or during the early phases of building. Those who buy before this moment pay the pre-transformation price. Those who buy after pay the price that already reflects market expectations.
How much did Parque das Nações in Lisbon appreciate?
Parque das Nações in Lisbon appreciated +300% for those who bought between 1998 and 2004 — during and right after Expo 98 construction. The area went from a degraded industrial zone to one of Lisbon’s most valued addresses in less than 25 years. It’s the highest documented appreciation case among the international precedents cited in the Gehl Plan for Florianópolis.
What was the return for properties near the Guggenheim in Bilbao?
Areas near the intervention corridor in Bilbao — which included the Guggenheim Museum and regeneration of the Nervión River waterfront — appreciated +150% in the decades following the museum’s 1997 opening. Those who bought during construction between 1993 and 1997 captured most of that differential. The case is a worldwide reference for the “Guggenheim effect” — the use of a cultural anchor as a catalyst for urban regeneration.
Is the Gehl Plan for Florianópolis comparable to these international cases?
In terms of methodology, yes — the same office used the same method (PSPL, field data collection, proposals based on actual pedestrian behavior) in Copenhagen and Florianópolis. In terms of scale and economic context, the European cases have relevant differences from the Brazilian market. The comparison is useful for understanding market behavior patterns, not for projecting identical numbers.