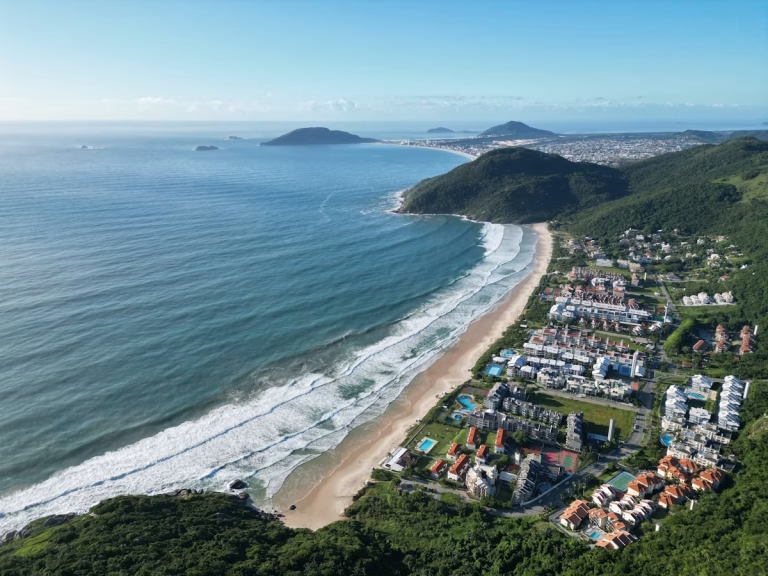
Itacorubi occupies a unique position in Florianópolis’s university corridor. It is the city’s 4th most populous neighborhood — yet still practices m² about 14% below the general average. Investors who look only at price indices cited in the media miss this difference. Those who research in depth find a market with solid fundamentals and an entry point not yet corrected.
The neighborhood combines perennial rental demand — sustained by institutions like CELESC, EPAGRI, FIESC, CEPON, UDESC, and UFSC-CCA — with a permanent supply constraint: the Itacorubi Mangrove, with 216.47 hectares of federally protected wetland in the eastern strip. This combination creates a predictable market, consistent appreciation, and low volatility. It is not a fad. It is structure.
Understanding the Itacorubi market therefore requires granularity. The average m² is a useful reference, but the real differentials appear by sub-region, by property type, and by demand profile. This guide brings together available data from 2024–2026 so you make decisions based on real numbers, not perceptions.
Consolidated price data (2024–2026)
| Indicator | Value | Reference | Source |
|---|---|---|---|
| Average m² sale | R$ 11,220/m² | 2024 | Loft.com.br |
| Average m² sale | ~R$ 11,483/m² | 2025 | Internal data Regente Imóveis |
| m² Florianópolis general | R$ 13,106/m² | April/2026 | General market data Florianópolis |
| Estimated appreciation | ~7.7% yearly | 2025 | Internal data Regente Imóveis |
| Minimum ticket (apartments) | R$ 699,000 | 2024 | Loft.com.br |
| Maximum ticket (apartments) | R$ 1,849,000 | 2024 | Loft.com.br |
| Inventory for sale | 1,615+ listings | April/2026 | Imovelweb |
| Rental inventory | 134 apartments + 329 properties | April/2026 | Imovelweb |
Itacorubi practices m² about 14% below Florianópolis’s general average (R$ 13,106/m²), positioning it as a cost-benefit destination in the central university corridor compared to Trindade and Agronômica.
For those wanting to understand more about Itacorubi’s real estate market in detail, inventory data and average ticket are the correct starting point.
Historical appreciation
- Florianópolis general (2015–2026): m² rose from R$ 6,305 → R$ 13,106 — +108% in ~11 years (general market data Florianópolis)
- Rental Floripa (2024): +10.39% in 12 months — 3× inflation (FipeZAP)
- Itacorubi specific: ~7.7% yearly (estimated proxy — validate with Secovi-SC/CRECI-SC)
Comparison with neighboring neighborhoods
| Neighborhood | m² sale | Profile |
|---|---|---|
| Trindade | ~R$ 12,500+ | UFSC-university, high |
| Agronômica | ~R$ 12,000–14,038 | High-end residential |
| Itacorubi | R$ 11,220–11,483 | Institutional-residential, middle-upper |
| João Paulo | ~R$ 10,000–11,000 | Middle-upper residential |
| Córrego Grande | ~R$ 9,500–10,500 | Middle residential |
Itacorubi falls between Trindade and Córrego Grande in pricing — with institutional supply far superior to most neighborhoods in this price range.
Typological profile of inventory
- Dominant product: 2–3 bedroom apartments, 4–12 stories on major axes
- Growth: studios for university students and corporate migrants (profile similar to Pantanal)
- Rare and valued: houses on interior streets — few units available
- Verticalization: moderate; Master Plan preserves building height average — no skyscrapers
Recent launches (2024–2025)
- Residencial Maria Augusta: across from UDESC; 2–3 bedrooms; 5 towers
- Smart Living Studio 2855: studios on Rua Amaro Antônio Vieira — targeting university students and IT professionals
Rental by typology: price ranges in 2025
The rental market in Itacorubi has one of the most stable demand curves in Florianópolis. There is no dependence on tourist season. Demand comes from 12- to 36-month leases, with a long-term occupancy profile.
Below are the ranges practiced on real estate portals in 2025:
- Studio / 1 bedroom (up to 40m²): R$ 1,800–2,400/month. Profile: graduate students, early-career professionals, newly hired civil servants.
- 2 bedrooms (~65–80m²): R$ 2,500–3,500/month. The neighborhood’s most liquid segment. Young couples or professionals with stable income. Low vacancy.
- 3 bedrooms (~90–120m²): R$ 3,800–5,200/month. Families with children or groups of professionals. Slower absorption, but consistent demand.
- Houses (interior streets): R$ 4,500–7,000/month. Rare product, demand from established family profile.
Differential vs. beaches: vacation rentals are not Itacorubi’s product. Demand is long-term, from tenants with stable income. The neighborhood’s rental profile resembles Pantanal and Trindade more than Ingleses or Jurerê. This reflects in more predictable cap rate for the investor.
Absorption speed: how long a property stays on market
Absorption speed measures the average time between listing publication and contract signing. In Itacorubi, this varies by typology and position within the neighborhood.
Av. Madre Benvenuta axis concentrates greater liquidity. Properties listed in this region with market-range pricing tend to absorb in 15 to 45 days for rental and 60 to 120 days for sale.
Given this, the neighborhood’s seasonality profile deserves attention:
- March–April: peak rental demand. Inflow of new civil servants and master’s students in academic semester.
- July–August: second peak, more moderate. Semester intake at UDESC/UFSC and new institutional hires.
- December–February: slower movement for long-term residential rental. Ideal for sellers — year-end buyers have a more decisive profile.
The inventory of 1,615+ properties for sale (Imovelweb, April/2026) represents a market with reasonable liquidity. On the other hand, the low rate of new launches — a direct consequence of wetland protection — avoids the supply accumulation that would depress prices in other neighborhoods.
The mangrove as supply protection
This is the most underestimated structural factor in Itacorubi’s market. The Itacorubi Mangrove — Brazil’s 2nd largest urban mangrove, with 216.47 hectares — is protected wetland (APP) under Federal Law 12,651/2012. No new development can be approved in the eastern strip of the neighborhood.
The market effect is direct:
- Inventory does not grow on the eastern axis. New units enter the market only via Av. Madre Benvenuta axis and interior streets, where building height is also limited by the Master Plan.
- Demand does not stop. The institutional hub continues attracting professionals and students every year.
- Result: upward pressure on prices and rental value — without the dilution risk affecting neighborhoods with available land for new launches.
This dynamic sustains the estimated appreciation of ~7.7% yearly (Piramides 2025) even with the neighborhood still below Florianópolis’s general average. There is room for price convergence without depending on speculation.
For those wanting to understand the urban planning implications of this constraint, the Itacorubi urbanization guide details zones, building height, and what the 2023 Master Plan changed.
Rental market
Itacorubi has structurally solid rental demand for three reasons:
- Public servant demand: CELESC, EPAGRI, CEPON, and FIESC generate out-of-city hires needing stable housing
- University demand: UDESC ESAG/CEART and UFSC-CCA attract graduate students — a long-term occupancy profile (2–4 years)
- IT professionals: the tech hub of the Trindade-Itacorubi corridor uses the neighborhood as residential base
Differential vs. beaches: no seasonality. Rental demand in Itacorubi is perennial and long-term, without the summer peak and winter valley of beach areas.
Sub-region in accelerated appreciation: surroundings of Hotel Mercure
The first part of Itacorubi — the Rod. Admar Gonzaga axis near Hotel Mercure — is experiencing above-neighborhood-average appreciation, driven by a cluster of road and commercial interventions concentrated in the region:
- New CIC access lane and elevated road: significant improvement in road connectivity that reduces travel time and boosts the axis’s appeal for residents and investors.
- Hippo opening at America Offcenter: new large-scale retail anchor in the region, attracting foot traffic and appreciating surrounding residential area.
- Road loop plan between Rod. Admar Gonzaga and Rua Pr. William Richard Schisler Filho: mobility intervention that eases traffic and improves neighborhood access.
- Construction of 2 roundabouts: improves local traffic flow and road safety — a relevant factor for perceived quality of life and property value.
Properties in this sub-axis have potential to capture appreciation above Itacorubi’s average in the short and medium term, as these interventions complete and get priced in. Regente, active in the neighborhood since 1999, monitors these movements in real time.
What to monitor in 2026
- Advance of studio launches on Rod. Admar Gonzaga axis and Av. Madre Benvenuta
- Result of FipeZAP sector-level data for Itacorubi (still under-represented in indices)
- Possible road works on Rod. Admar Gonzaga — temporary liquidity impact
Frequently asked questions about Itacorubi’s real estate market
Is Itacorubi expensive to buy in Florianópolis?
Not relatively. Average m² of R$ 11,220–11,483 is about 14% below Florianópolis’s general average (R$ 13,106/m² in April/2026). For a neighborhood with a consolidated institutional hub, alternative schools, and access to Brazil’s largest urban mangrove, the price still represents high value for money versus Trindade and Agronômica. Check available properties in Itacorubi for ticket reference by typology.
What appreciation is expected for Itacorubi in 2025–2026?
The available estimate is ~7.7% yearly (Piramides 2025). This number is a proxy — there is no isolated official historical series for the neighborhood published by FipeZAP. The data needs validation with Secovi-SC or CRECI-SC for use in formal analysis. The structural trend, however, is consistent appreciation as long as institutional demand remains active and the mangrove blocks new launches in the eastern strip.
Does rental in Itacorubi have seasonality?
It has mild seasonality, tied to the academic calendar (March and July). But it is far less volatile than beaches. Corporate and graduate demand creates continuous flow throughout the year. For the investor, this means lower risk of extended vacancy.
Is it worth buying to rent in Itacorubi in 2025?
The estimated gross cap rate is 4.0–5.6% yearly — in line with FipeZAP benchmark for Florianópolis (4.77% yearly for 2+ bedrooms). It is not the city’s highest yield, but defensive demand and supply protection via wetland protection make the return more predictable than in neighborhoods with high new-launch supply. See the investment analysis for Itacorubi for detailed simulation.
Which Itacorubi sub-regions have greater liquidity?
Av. Madre Benvenuta axis concentrates greater rental liquidity — proximity to UDESC, commerce, and bus lines. Rod. Admar Gonzaga serves the corporate-institutional profile well. Interior streets have slower turnover, but higher appreciation potential in houses. For a specific assessment of your property, the diagnosis must consider the exact sub-region.
Regente Imóveis: local reference in Itacorubi
Anyone buying, selling, or renting in Itacorubi needs someone who knows the sub-regions — not just portal data. Regente Imóveis has operated in Itacorubi since 1999 and monitors the university corridor market with comparable analysis, proprietary transaction data, technical assessment, and legal support throughout the entire operation.
Source: Loft.com.br 2024, FipeZAP 2024, Imovelweb April/2026, internal data Regente Imóveis (neighborhood operations since 1999).